


Over the past decade, the GTA real estate market has experienced one of the most dramatic cycles in its history. Media headlines over the last five years have focused on soaring prices, sudden corrections, and ongoing uncertainty.
But when we step back and examine the data over a full market cycle, a much calmer — and more useful — picture emerges.
The charts below are designed to separate short-term noise from long-term reality, helping buyers and sellers make confident, informed decisions.
Market Volatility vs Long-Term Reality
GTA Home Price Growth Rates (All Home Types)
The first chart compares year-over-year price changes with the long-term compound annual growth trend (CAGR) from 2015 through 2025.
.png)
What the chart shows clearly:
- Year-over-year percentage changes in prices are volatile
- Sharp spikes in 2016 and 2021
- Meaningful pullbacks by the end of 2017 and again after the 2022 peak
- This volatility is what dominates headlines and fuels uncertainty
- The long-term trend is far more stable
- From 2010–2015, prices grew at about 7.0% annually
- By 2019, long-term growth peaked near 8% for the previous 10 years
- By the end of 2025, the 10-year growth rate had settled at 5.1%
- This trend line now sits below the pandemic-era highs
Why this matters:
While short-term price movements have been extreme, the long-term trend has quietly normalized. Much of the rapid price growth from 2020–2022 has been erased, effectively resetting affordability back toward a pre-pandemic trajectory.
In simple terms:
The market hasn’t collapsed — it has recalibrated.
How Different Home Types Performed Across the Cycle
GTA Home Price Growth by Property Type
The second chart breaks down price performance by property type across the same market
phases.
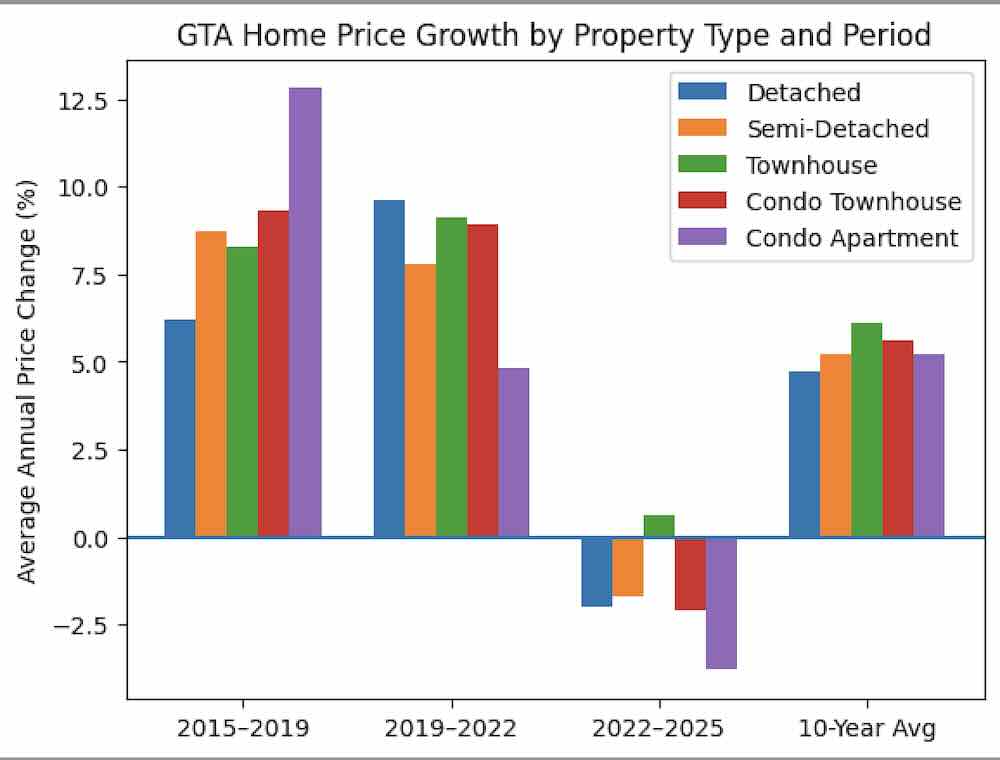
Key insights by segment:
Detached Homes
- Lowest long-term growth rate at 4.7% annually
- Experienced meaningful correction post-2022
- Creates opportunities for move-up buyers who were priced out during the peak years
Semi-Detached Homes
- Steady and consistent growth
- 5.2% average annual growth over 10 years
- A balanced option for buyers seeking space with long-term stability
Townhouses
- One of the most resilient segments
- Maintained positive growth even after 2022
- Strong choice for buyers prioritizing value, space, and affordability
Condos (Townhouse & Apartment)
- Historically the most volatile
- Larger swings during boom and correction phases
- Despite recent declines, long-term growth remains solid for condo townhouses
The takeaway:
Each property type responded differently to market extremes, but all segments have now returned to historically normal growth ranges, creating a more predictable and balanced environment for decision-making.
What This Means for Buyers and Sellers Today
First-Time Buyers
Average selling prices are now below their 10-year historical trend. While conditions vary by neighbourhood and home type, today’s market is meaningfully more favourable than it has been in several years — especially for financially prepared buyers.
Curious what you could comfortably afford today?
Book a complimentary home affordability consultation and see what’s realistically within reach.
Move-Up Buyers
Larger homes — particularly detached properties — have seen the lowest long-term growth and the largest corrections from peak pricing. Homes that felt out of reach just a few years ago may now fall within realistic budgets.
This is one of the rare moments where upgrading can make sense without overpaying.
Sellers
Today’s market rewards strategy, pricing, and preparation — not speculation. Buyers are active, but informed. Homes that are priced correctly and well-positioned are still selling, while overpriced listings are being passed over.
Wondering what your home could sell for in today’s market?
Request a free, no-obligation home valuation and market analysis.
The Big Picture
- The past five years were extreme — historically so
- Long-term price growth has normalized to sustainable levels
- Mortgage rates, while higher than 2021–2022 lows, remain reasonable by 15-year historical standards
- For financially confident households with at least a 5% down payment, today represents one of the most balanced decision points in over a decade
Reframing the Market
These charts are not about predicting short-term price movements. They are about context — reminding us that real estate markets move in cycles, not straight lines.
Economic growth, job creation, consumer confidence, and global trade conditions will continue to influence outcomes. But for buyers and sellers focused on fundamentals rather than fear, the data suggests opportunity — not risk — is defining today’s market.
The Toronto Regional Real Estate Board reported this past week the results of January's market activity and it far from exciting.
Latest TRREB Report Summary. Market Watch
There were 3,082 home sales reported in January 2026 – down by 19.3 per cent compared to January 2025. New listings amounted to 10,774 – down by 13.3 per cent year-over-year and total available homes for sale were 17,935 at month end. Bad weather has likely been a contributor to the slow start this year. The significant decline in available homes for sale from late Fall, if we don't see and increase in the coming weeks, will put more pressure on prices as buyers re-emerge in the weeks ahead. Currently TRREB reported a 5 month inventory of homes based on recent sales.
Average selling price for all home types was reported at $973,289 and this made all the headlines as this was lower than it has been in 5 years. Detached homes still sold for an average of $1,277,915 with all major GTA communities, except Durham Region, reported average selling prices well north of $1.2 million. Durham Region on the whole was under million dollars, with an average price of $925,397 making it a more affordable place to live.
Final Thought
The GTA market has reset.
For buyers and sellers willing to act based on data — not headlines — this may be one of the best window of opportunity we’ve seen in years.
If you would like more detailed analyses on communities of interest in the GTA, or wish to talk about buying or selling, please contact us, we are here to help.